
| 일 | 월 | 화 | 수 | 목 | 금 | 토 |
|---|---|---|---|---|---|---|
| 1 | 2 | 3 | 4 | 5 | 6 | 7 |
| 8 | 9 | 10 | 11 | 12 | 13 | 14 |
| 15 | 16 | 17 | 18 | 19 | 20 | 21 |
| 22 | 23 | 24 | 25 | 26 | 27 | 28 |
| 29 | 30 |
- Python 특징
- 정규분포 MLE
- 딥러닝
- 부스트캠프 AI테크
- 표집분포
- subplot
- 가능도
- Numpy data I/O
- linalg
- Python
- 카테고리분포 MLE
- boolean & fancy index
- Comparisons
- 최대가능도 추정법
- python 문법
- VSCode
- dtype
- BOXPLOT
- scatter
- unstack
- Numpy
- pivot table
- Array operations
- namedtuple
- ndarray
- Operation function
- Python 유래
- type hints
- groupby
- seaborn
- Today
- Total
또르르's 개발 Story
[Stage 2 - 01] EDA 본문
1️⃣ Goal
- [BaseLine 작성] (추가 : 4/12, 새로운 Baseline code)
- [Data Processing]
- Exploratory Data Analysis (추가 : 4/12, 기간 : 4/12 ~ )
- Cross-validation 사용 (추가 : 4/12)
- 데이터 불균형 해소 (추가 : 4/12)
- 새로운 tokenizer 사용 (추가 : 4/12) - [Model]
- BERT 모델 사용 (추가 : 4/12)
- GPT 모델 사용 (추가 : 4/12)
- ELECTRA 모델 사용 (추가 : 4/12)
- KoBERT 모델 사용 (추가 : 4/12) - [Training]
- 앙상블 시도 (추가 : 4/12)
- Hyperparameter 변경 (추가 : 4/12)
- Learning Schedular 사용 (추가 : 4/12)
- 좋은 위치에서 Checkpoint 만들기 (추가 : 4/12)
- NNI (Auto ML) 사용 (추가 : 4/12) - [Deploy]
- Python 모듈화 (추가 : 4/12)
2️⃣ Learning
[Stage 2 - 이론] 자연어 단어 임베딩
1️⃣ Word2Vec 1) Word2Vec 의미 단어가 가지는 의미 자체를 다차원 공간에 '벡터화'하는 것 중심 단어의 주변 단어들을 이용해 중심 단어를 추론하는 방식으로 학습 2) 장점 단어간의 유사도 측정에
dororo21.tistory.com
3️⃣ Main Task
1) Exploratory Data Analysis (EDA)
train.tsv 데이터를 받아오면 다음과 같습니다.
trainfile = pd.read_csv("/opt/ml/input/data/train/train.tsv", sep='\t', names=["wiki-num", "sentence", "entity01", "entity01_start", "entity01_end", "enttity02", "entity02_start", "entity02_end", "label"])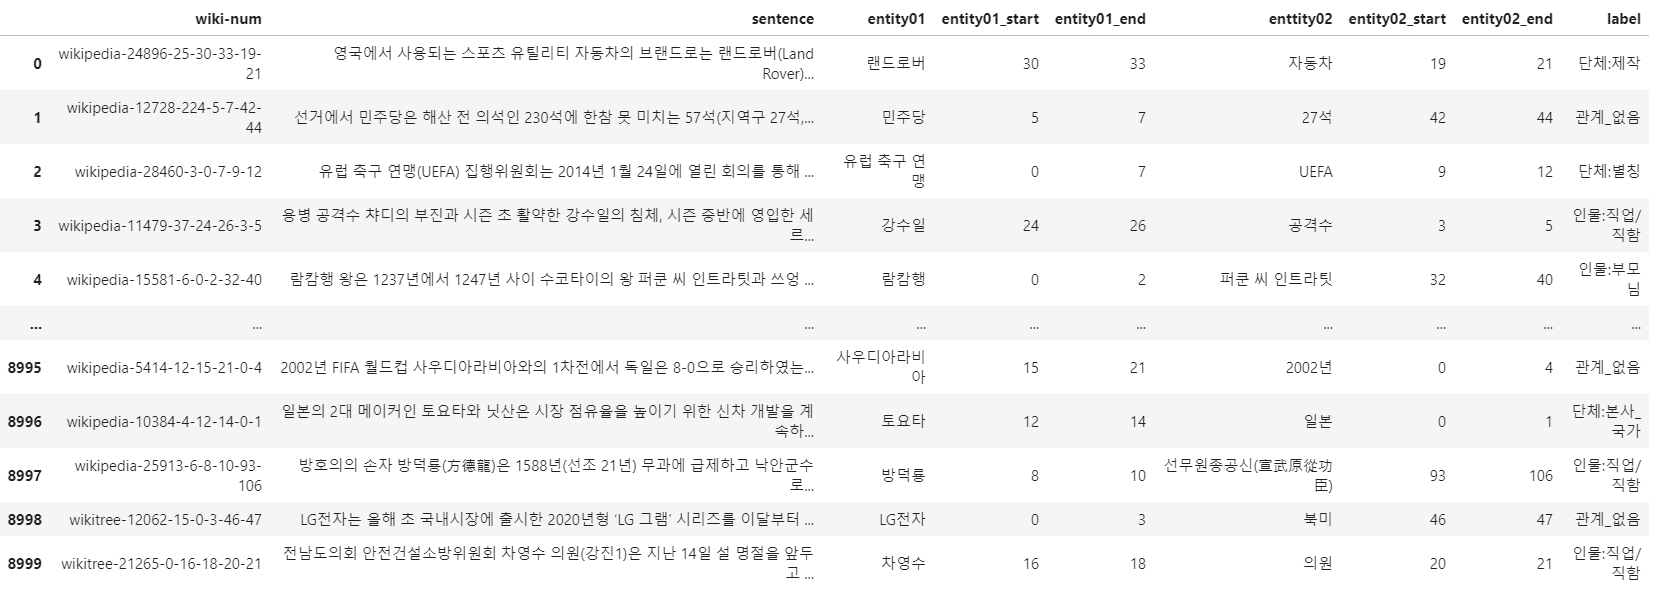
entity01과 entity02의 상관관계를 구하는 것이 이번 프로젝트의 목표입니다.
label들을 확인하면 class들의 분포가 불균형하다는 것을 알 수 있습니다.
>>> trainfile['label'].value_counts()

관계_없음          4432
단체:구성원          815
인물:소속단체         683
인물:직업/직함        553
단체:상위_단체        335
단체:별칭           231
인물:출신성분/국적      209
인물:동료           186
단체:제작           171
인물:부모님          164
단체:본사_도시        135
단체:본사_국가        115
인물:별칭           103
인물:배우자           92
인물:자녀            84
단체:하위_단체         79
단체:창립일           67
인물:기타_친족         58
인물:제작            56
인물:형제/자매/남매      52
단체:창립자           45
인물:사망_일시         45
단체:모회사           44
인물:출생_일시         36
인물:거주_국가         27
인물:거주_도시         26
단체:본사_주(도)       23
단체:정치/종교성향       18
단체:해산일           15
인물:종교            15
인물:거주_주(도)       12
인물:용의자           11
단체:주주            11
인물:학교             9
단체:구성원_수          9
인물:출생_국가          8
인물:사망_원인          7
단체:자회사            6
인물:나이             5
인물:출생_도시          4
인물:사망_도시          3
인물:사망_국가          1
Name: label, dtype: int64
따라서 Matplotlib를 사용해 그래프를 그리면 다음과 같습니다.
plt.figure(figsize=(20, 3))

plt.title("Histogram", fontsize=15)

frq, bins, fig = plt.hist(trainfile["label"], bins=10, alpha=.8, color='red')

plt.ylabel("개수", fontsize=13)

plt.xlabel("label", fontsize=13)

plt.xticks(rotation=90)

plt.grid()

plt.show()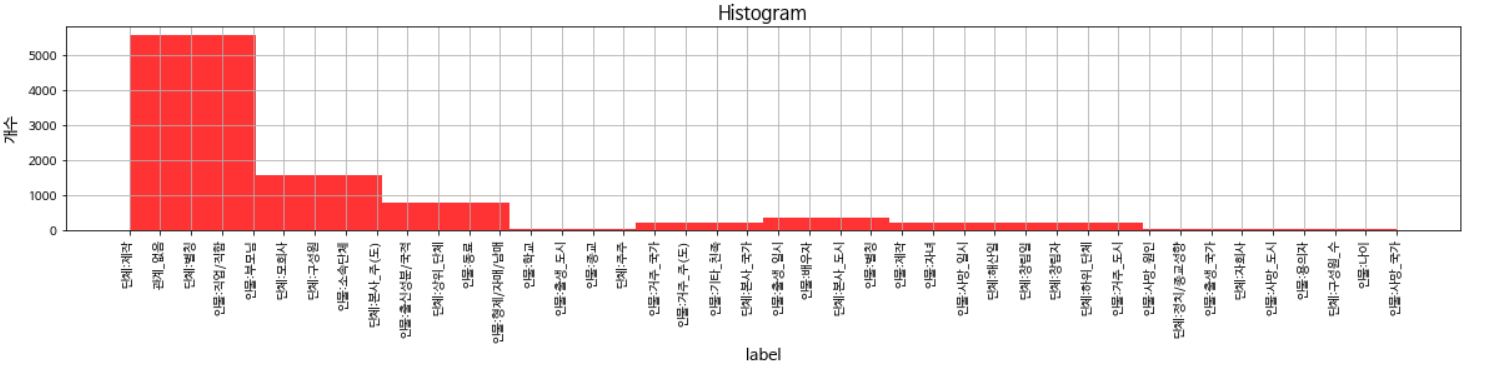
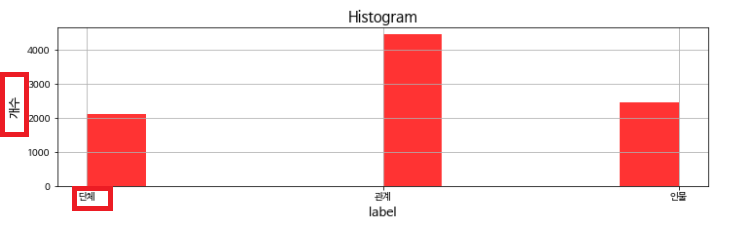
entity01의 분포는 3개로 나눠집니다.
- 단계
- 관계(없음)
- 인물
plt.figure(figsize=(12, 3))

plt.title("Histogram", fontsize=15)

frq, bins, fig = plt.hist([x[:2] for x in trainfile['label']], bins=10, alpha=.8, color='red')

plt.ylabel("개수", fontsize=13)

plt.xlabel("label", fontsize=13)

plt.grid()

plt.show()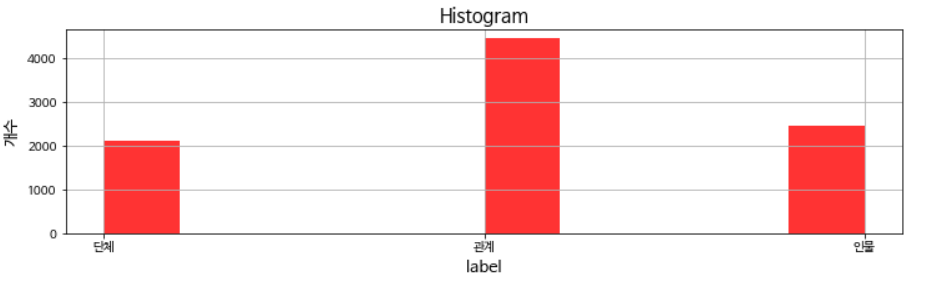
entity02의 분포는 전체 label의 개수와 비슷합니다.
plt.figure(figsize=(20, 3))

plt.title("Histogram", fontsize=15)

frq, bins, fig = plt.hist([x[3:] for x in trainfile['label']], bins=10, alpha=.8, color='red')

plt.ylabel("개수", fontsize=13)

plt.xlabel("label", fontsize=13)

plt.xticks(rotation=90)

plt.grid()

plt.show()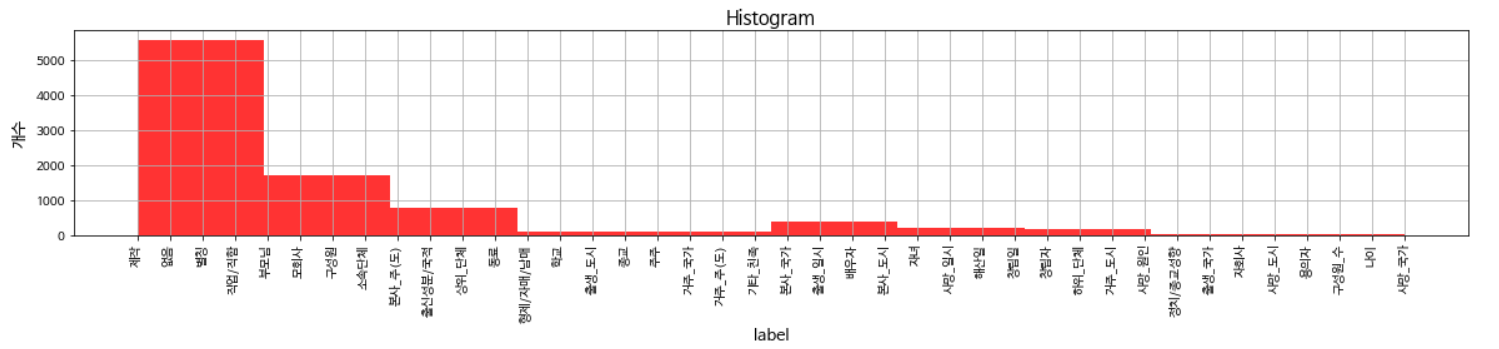
4️⃣ Sub Task
1) Matplotlib 한글 font 적용하기
Matplotlib는 기본적으로 한글 font를 출력하게 되면 글자가 깨지게 됩니다.
따라서 font를 등록 해주어야합니다.
Matplotlib의 pyplot, font_manager를 불러옵니다.
import matplotlib.pyplot as plt

import matplotlib.font_manager as fm

import matplotlib as mpl
현재 등록되어있는 font를 보고 싶다면, font_manager의 findSystemFonts 함수를 통해 알 수 있습니다.
font_list = fm.findSystemFonts(fontpaths=None, fontext='ttf')
출력해보면 다음과 같습니다. (저는 이미 Nanum 글씨를 설치했기 때문에 font_list에 표시됩니다.)
>>> font_list

['/usr/share/fonts/truetype/nanum/NanumBarunGothic.ttf',
 '/usr/share/fonts/truetype/nanum/NanumGothic.ttf',
 '/usr/share/fonts/truetype/nanum/NanumGothicBold.ttf',
 '/usr/share/fonts/truetype/nanum/NanumSquareRoundB.ttf',
 '/usr/share/fonts/truetype/nanum/NanumMyeongjo.ttf',
 '/usr/share/fonts/truetype/nanum/NanumBarunGothicBold.ttf',
 '/usr/share/fonts/truetype/nanum/NanumSquareR.ttf',
 '/usr/share/fonts/truetype/nanum/NanumSquareB.ttf',
 '/usr/share/fonts/truetype/nanum/NanumSquareRoundR.ttf',
 '/usr/share/fonts/truetype/nanum/NanumMyeongjoBold.ttf']
가장 많이 사용하는 한글 font인 Nanum font를 사용하기 위해서는 apt로 설치합니다.
(jupyter notebook이나 colab에서 설치할 경우이며, 한 번만 실행하면 됩니다. 이후, Kernel을 다시 실행합니다.)
%config InlineBackend.figure_format = 'retina'!apt -qq -y install fonts-nanum
(여기서 font_manager._rebuild()는 mlp 버전이 업데이트되면서 사라졌습니다. 따로 _rebuild를 해주지 않아도 됩니다.)
# mpl.font_manager._rebuild()
Pyplot에서 사용하고 싶은 font 경로를 받아와서 font를 plt에 등록합니다.
fontpath = '/usr/share/fonts/truetype/nanum/NanumBarunGothic.ttf'

font = fm.FontProperties(fname=fontpath, size=9)

plt.rc('font', family='NanumBarunGothic')
plt.show()를 하면 한글 font가 깨지지 않고 잘 나오는 것(빨간 박스)을 알 수 있습니다.
5️⃣ Evaluation
| 날짜 | Data processing | Model | Training | Time | Accuracy | F1 |
| 4/13 | - EDA - |
1h | - | - | ||
1) Exploratory Data Analysis (EDA)
- EDA를 통해 데이터 분포를 확인하는 것은 중요한 작업 중 하나입니다.
- 이번 프로젝트 또한, 데이터의 불균형 문제가 있기 때문에
- UpSampling, DownSampling, Imbalance Sampler 등을 사용하거나,
- 다양한 Loss를 사용해볼 생각입니다.
2) 차후 목표
- Word2Vec을 대체할 수 있는 임베딩 방법 찾기
- 최적의 Tokenizer 찾기
'[P Stage 2] KLUE > 프로젝트' 카테고리의 다른 글
| [Stage 2 - 05] Pororo 라이브러리 사용하기 (0) | 2021.04.20 |
|---|---|
| [Stage 2 - 04] Entity Special token (0) | 2021.04.20 |
| [Stage 2 - 04] BERT MASK & 단일 문장 분류 (0) | 2021.04.16 |
| [Stage 2 - 03] BERT (0) | 2021.04.15 |
| [Stage 2 - 02] 한국어 전처리 / 토크나이징 (0) | 2021.04.14 |


